Final research paper · VLOT! Campus Sint-Laurentius, 2024–2025 ·
Download the original PDF →
Abstract
This paper details a research project spanning a school year; it describes the entire process, along with the results and conclusions. The project aimed to determine the correlation between type system and performance. The results indicate a relatively mild correlation in favor of static languages for performance. A number of tests were done to draw this conclusion; the main ones, however, were the correlation calculations. The correlation was calculated in two ways. The first was the Point-Biserial correlation. This test indicated a correlation with medium effect size, but was not particularly statistically significant according to the resulting p-value. This statistical insignificance was likely due to the effect of outliers on the distribution of raw data and the non-normal distribution of that data. To counteract this, the Rank-Biserial correlation (which is influenced far less by outliers) was calculated as well, which resulted in a very similar effect size but with an extremely low p-value, confirming its significance. The Rank-Biserial correlation therefore allowed for a more robust conclusion, and the combination of these methods provides more insight into the results of this project.
However, this project was subject to a number of limitations (mostly in skill, experience, knowledge, scale, time, and resources), which, by extension, allow for various valid criticisms. The main problem is the small sample size of only 14 languages: 7 static and 7 dynamic. The fact that only the execution time per language was measured, as opposed to a combination of metrics, can also be called into question. This paper also describes several additional analyses which help clarify the relationship between type system and performance.
Introduction
Motivation and practicality
My name is Arne Vercauteren and I study computer science. The subject of this paper — type systems — was chosen because I have a great personal interest in programming languages and their design and functionality.
In real-world, large-scale systems, performance is of incredible importance; choosing the right framework for your system can entail massive benefit when done right, or great loss when done wrong. In large corporations, for example, making the wrong choice can cause massive economic strain, while making the right choice can give you an edge over the competition. Performance is important not only for developers, but also for consumers: smoother experiences, shorter waiting times during startups, and quicker web pages are just a few examples. By measuring the correlation between type system and performance, this paper attempts to help computer science at large in obtaining a clearer view of what the benefits of static and dynamic type systems are, and therefore in making the right choice between them considering the specific use case and requirements (although it only touches on a single aspect of what influences such a choice, namely the performance).
Concept details
What is a type? A type is a classification or group, like a type of physical object or a type of abstract idea. You can also have types within other types. For example, a dog is a type of animal, so is a cat; an animal is a type of living being. Nine is a number, specifically a natural number; a natural number is a type of number, and a number is a type of character. In programming, types are used to define not only what exactly something is, but also how we can use it — it has what we call an interface. In practice, an interface is a set of functions: a dog can bark, a cat can meow, but they can both eat. So we would give both the cat type and the dog type separate sound functions, but the type animal would get an eat function. Type systems are used to make the language make sense; the type system will throw an exception when you try to count with dogs or make a number meow.
What is a type system? "A type system is a tractable syntactic method for proving the absence of certain program behaviors by classifying phrases according to the kinds of values they compute." (Pierce, 2002, p. 1) There are many distinctions one could make between type systems. For this project, the sole distinction will be between static and dynamic type systems. In dynamic type systems, type checking is performed at runtime and variables can change types throughout the program. In static type systems, type checking is performed during compile time and variables are generally not allowed to change types throughout the program. (GeeksForGeeks, 2019)
What does performance mean in this context? "Performance" could be interpreted in a wide variety of ways; we could measure execution time, but also memory usage, compilation speed (for compiled languages), or even energy efficiency. To keep this project manageable, we will take the simple (and most obvious) approach and only measure execution time.
Considering the audience for this paper and its low-level academic nature, some topics and concepts that might not usually need to be explained in a professional paper are given a short explanation here. A big thank you to the supervising teacher for the support of this project.
Research
Program and language selection / homogenization
To accurately measure the correlation, 14 languages were chosen, and 7 (albeit simple) programs were implemented in every language, resulting in a total of 98 unique source-code files. The ideas for the implemented programs came from rosettacode.org. Rosetta Code is an online database containing thousands of code snippets: crowdsourced programs implemented in many languages. Although the selection of programs came from Rosetta, the actual implementations were written by AI and then verified — and, if necessary, edited — by the researcher.
Below is a list of the selected languages and programs:
Dynamic languages: Python, JavaScript, PHP, Perl, Lua, Julia, Awk.
Static languages: C, C#, Swift, Go, Java, Rust, Kotlin.
Programs:
- 100 doors (×10000)
- factorial with n = 10 (×100000)
- fibonacci sequence with n = 10 (×100000)
- fizzbuzz (×10000)
- reverse a string using
"Hello, World!"(×100000) - selection sort using
{29, 10, 14, 37, 13, 54, 76, 98, 12, 1, 64, 13, 512}(×100000) - sieve of eratosthenes using n = 10000 (×10000)
For-loops were wrapped around each program to obtain practical execution times (so as to avoid measuring in microseconds or nanoseconds for some languages); the numbers next to the programs correspond to the number of iterations.
The process of homogenizing such programs across different languages is one that comes with a plethora of challenges. Some languages have similar syntax but include different operations within the (seemingly) equivalent function; some do things automatically that others don't. Even though the programs used in this research were quite simple, and even though the chosen languages had very similar syntax, there are still countless corner cases one could encounter — not to mention the trouble that would be encountered if the languages and programs were selected randomly.
Program descriptions
100 doors creates an array of 100 booleans (doors), sets them all to false, then iterates over all of them and toggles them; then does the same but only with every 2nd boolean, then every 3rd, and so on, until it only toggles the 100th boolean; then it prints out every boolean's state.
Factorial calculates the factorial of n iteratively and then prints it; 10 is used as n here.
Fibonacci sequence calculates and prints Fibonacci numbers up to the n-th number recursively; 10 is used as n here.
FizzBuzz writes each number from 1 to 100, but writes Fizz when the number is divisible by 3, Buzz when it's divisible by 5, and FizzBuzz when it's divisible by 15.
Reverse a string reverses a string and then prints both the original and the reversed string; "Hello, World!" is used here.
Selection sort performs a selection sort on a given array of integers and prints out the result; this array is used here: {29, 10, 14, 37, 13, 54, 76, 98, 12, 1, 64, 13, 512}.
Sieve of eratosthenes calculates all prime numbers up to n; 10000 is used as n here.
The C# versions of each program have been provided in the appendix of the original paper as examples. All of the inputs have been hardcoded for ease of automation.
Methodological limitations
Because of the limited time, resources, and scope of this project, along with the limitations in skill, knowledge, and experience on the part of the researcher, there were certain limitations to the research method. The programs chosen for this project were mostly selected based on how easy they would be to verify given the knowledge and skill of the researcher, whereas in a project with more resources, larger, more realistic, and more diverse programs could be selected for a more accurate and comprehensive end result. Similarly, the selection of languages was mostly based on how accessible they were and on their relative lack of complexity; once again, in a project with more resources, this selection could be done more randomly. Most of all, the sample size of both languages and programs could be higher in such a project. As we will see in the conclusions, some conclusions cannot be pronounced definitive purely because of these limitations.
Script and measurements
After all of the source code had been collected, a script was used to automate the running of these programs in Docker using WSL, meaning Bash was used instead of a Windows-native alternative like Batch (the script was mostly written by AI, since the researcher had next to no knowledge of Bash). Originally, an attempt was made to use Batch, but support and available information on how to use it for these specific purposes proved to be lacking. The decision to use Docker was made to minimize interference from other processes while the programs were running. Docker is also highly useful because containers can be stopped and started within seconds, which makes scripting hundreds of runs easier. For the majority of the selected languages, an official Docker image is available; e.g., popular languages like Python and Go have official images maintained by the Docker community. Depending on the chosen languages, there will likely need to be some usage of non-official images (luckily, Docker Hub contains many qualitative alternatives), e.g., for Lua.
First, the script starts a separate container for each language and initiates some extra procedures, like installing the required libraries into each container. For the static languages, the script builds each program first within the container using the unique build commands for each language, combined with the path of the program. Most languages have built-in timing features, which allow for a more accurate measurement; if we were to do the timing in the script, we would be including the startup time for the runtime and other processes in our measurement. Unfortunately, Awk doesn't have built-in timing features, so instead the script measures an average overhead time by repeatedly running an empty program and calculating a trimmed average. This average should correspond to the average time it takes all the processes Awk needs to start. When that average time is subtracted from the execution time of each Awk program, the result should be an approximation of the actual execution time (although even if this overhead was not accurate, it turned out to be rather insignificant compared to the actual execution time for Awk programs).
Next, the programs are run one by one; the number of times this is done can be passed as a parameter when starting the script. Using this round-robin approach (instead of running a program the specified number of times and then moving on to the next one) ensures that the measurements are only minimally affected by temporary changes in processing speed, especially when the number of iterations is high. In terms of output, the script logs what it is doing in detail in a log file for easier debugging and prints the final results into a table in a CSV file. The Bash script is included in the appendix of the original paper.
This script should be run with a high number of iterations: the more iterations, the more accurate the results, and the more similar two separate runs of the script will be when compared. In this project, the script was run twice with 120 iterations; the results were sufficiently similar to be acceptable for use in analysis. A higher number of iterations would have resulted in more similarity, but it would have taken an unreasonable amount of extra iterations to produce a significantly higher accuracy (unreasonable meaning it would have taken too much time to run the script so many times — 120 iterations took around 16 hours, though a higher level of available resources could decrease this time dramatically).
Finally, Python was used to calculate the correlation, the details of which are explained further along. Some graphs were also made to clarify the relationship between the variables.
Results
Raw data
| Program | C | C# | Swift | Go | Java | Rust | Kotlin | Python | JavaScript | PHP | Perl | Lua | Julia | Awk |
|---|---|---|---|---|---|---|---|---|---|---|---|---|---|---|
| 100 doors | 113 | 895 | 1392 | 600 | 1907 | 505 | 1891 | 1375 | 2242 | 735 | 6701 | 1041 | 6168 | 4943 |
| factorial | 6 | 126 | 46 | 47 | 204 | 45 | 206 | 86 | 202 | 52 | 131 | 67 | 593 | 524 |
| fibonacci sequence | 113 | 854 | 504 | 725 | 1108 | 198 | 1105 | 2012 | 2525 | 1468 | 7186 | 1037 | 6208 | 19097 |
| fizzbuzz | 42 | 1035 | 348 | 580 | 1817 | 456 | 1828 | 536 | 2212 | 593 | 216 | 748 | 5745 | 1661 |
| reverse a string | 22 | 144 | 207 | 130 | 399 | 503 | 402 | 223 | 478 | 181 | 532 | 394 | 1160 | 1508 |
| selection sort | 175 | 2082 | 1388 | 1875 | 2950 | 446 | 2955 | 1727 | 3542 | 1874 | 1703 | 1103 | 16544 | 11005 |
| sieve of eratosthenes | 257 | 1646 | 2141 | 768 | 2210 | 1182 | 2266 | 2747 | 2790 | 1356 | 3479 | 1814 | 56522 | 20753 |
Table 1: Benchmark results (ms) for 120 runs.
The results have a massive range, even for the same programs. This is further illustrated in the boxplots below.
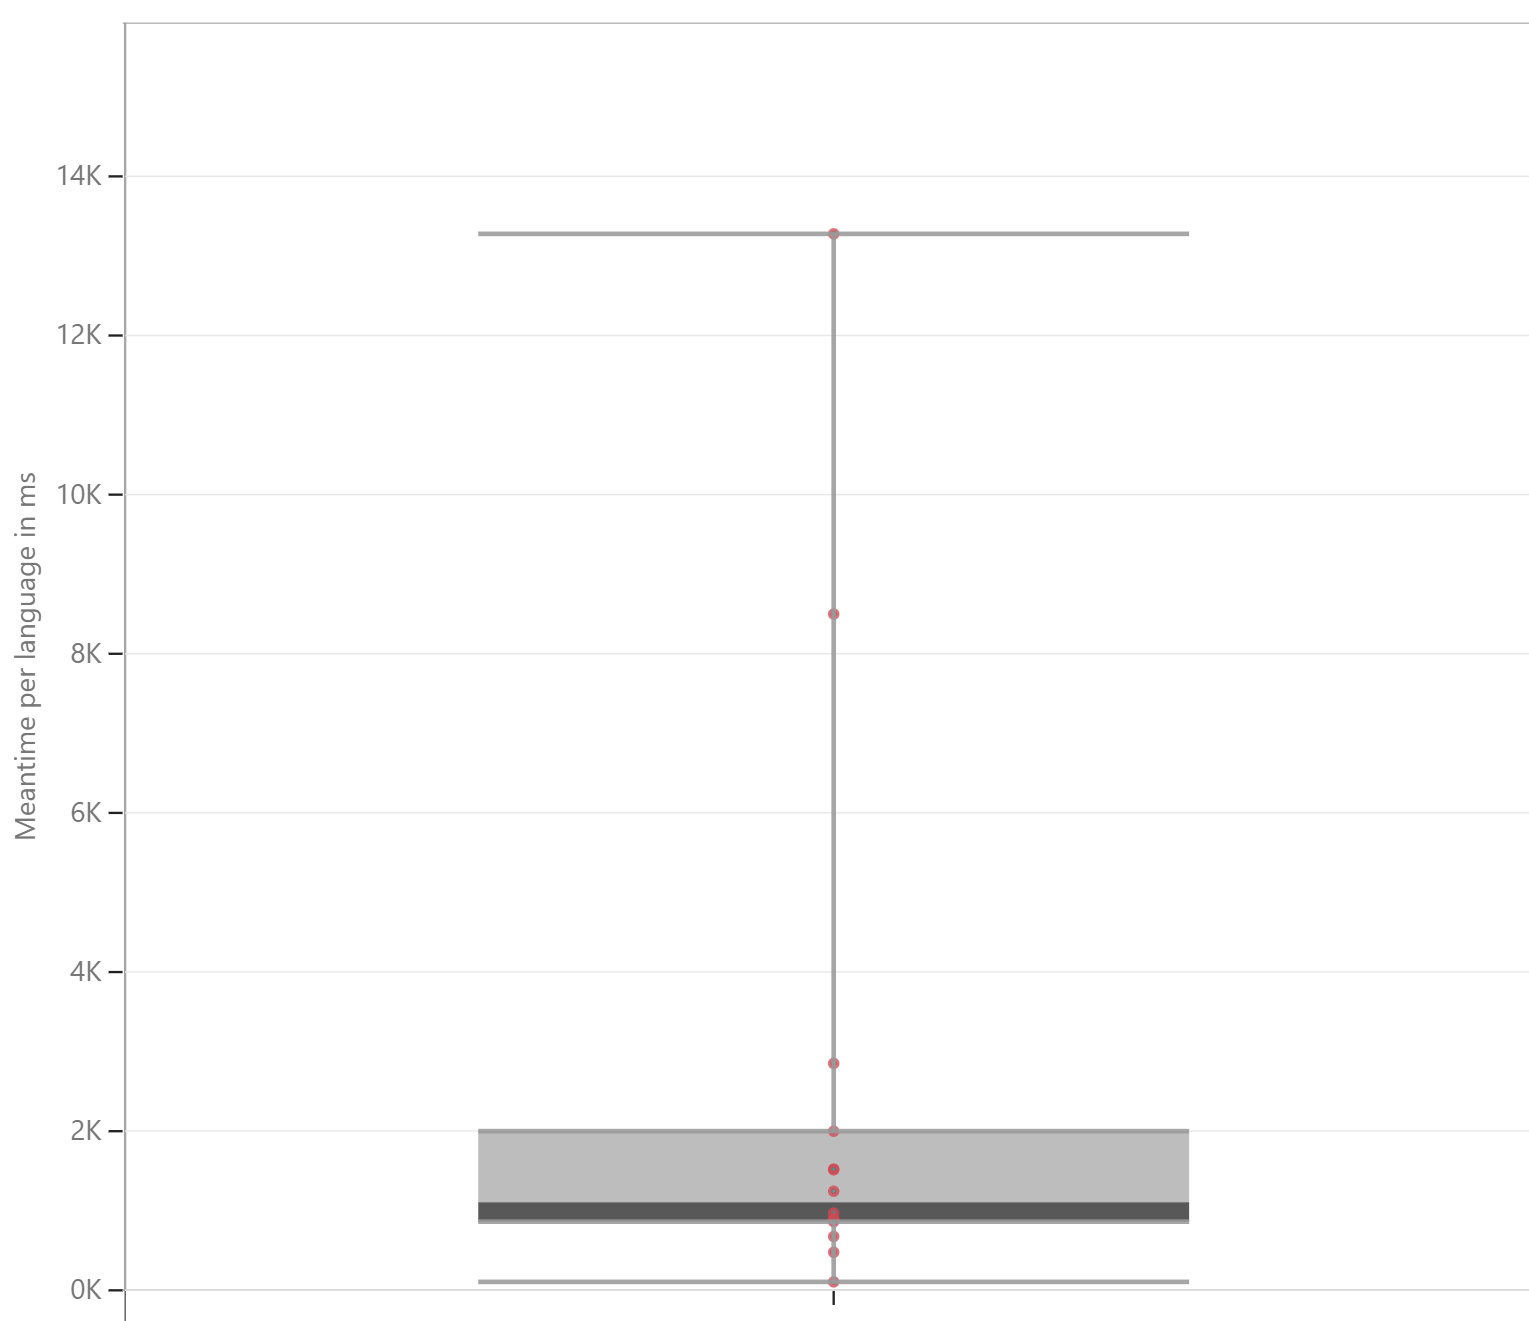
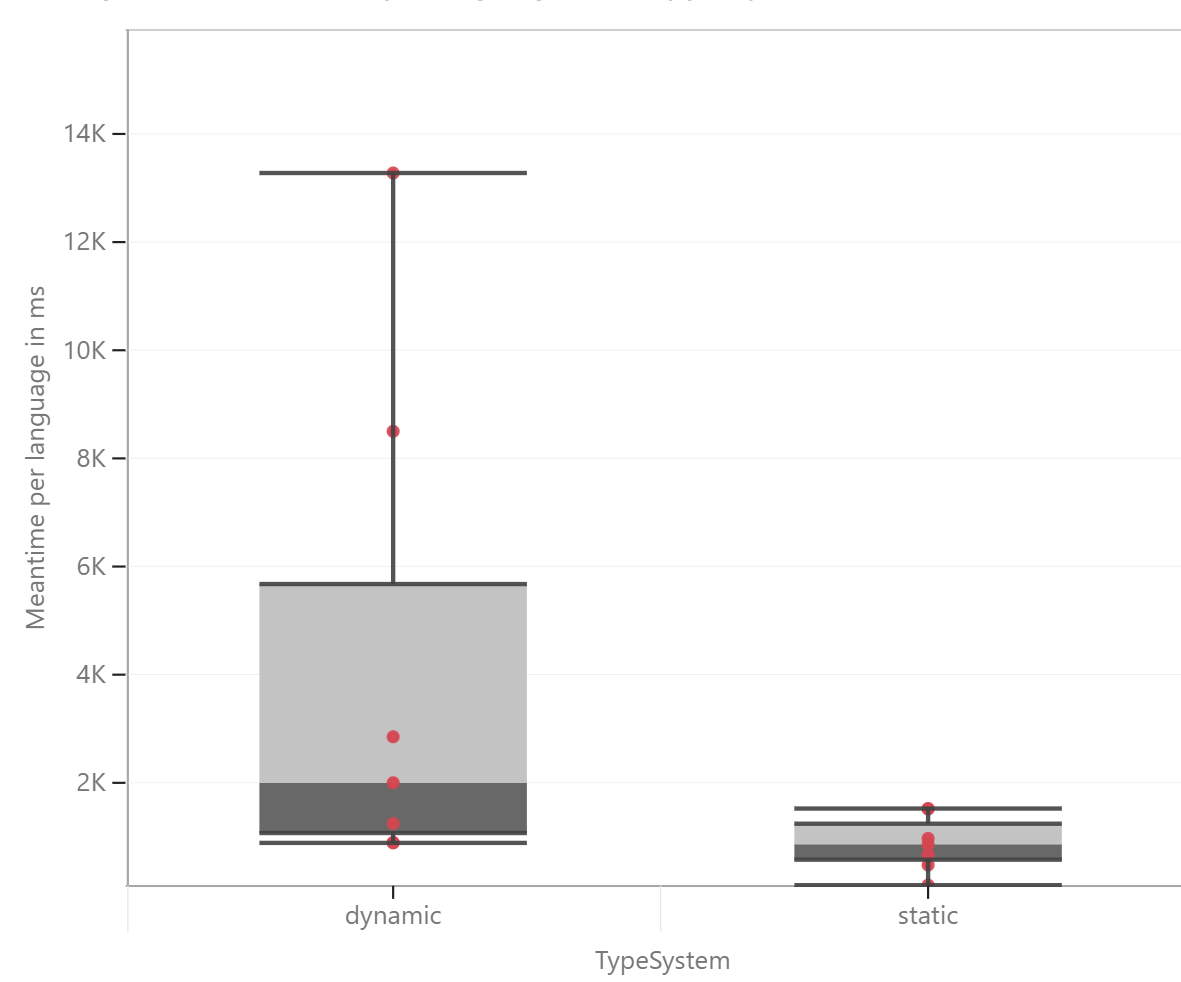
The two main outliers are Awk and Julia, both of which are dynamic, which can be seen clearly in Figure 2: the range for dynamic languages is many times larger than that of the static languages. It isn't just the range that's smaller for static languages — the median (1999 for dynamics, 860 for statics) and the average (4235 for dynamics, 874 for statics) are also much smaller for the static languages.
Correlation
Before calculating the correlation, we have to decide how to group our data points. We have 98 data points in total, but only 14 languages; if we were to use all of these data points for the correlation, we would be artificially inflating the sample size. Instead, we compute the mean of each language and use one data point per language to compute the correlation.
Point-Biserial correlation
Let's start with a simple approach: the Point-Biserial correlation. This is in effect the same as a Pearson correlation, except that one of the variables is dichotomous (type system) while the other is continuous (execution time). For clarity, the Pearson correlation coefficient is a measure of the strength and direction of the linear relationship between two quantitative variables and . (Wikipedia contributors, 2025b)
This formula — for the Point-Biserial correlation — is equivalent to calculating the Pearson correlation with the value coded as ones and zeros. For this calculation, static languages have been coded as 1 and dynamics as 0:
- is the mean of the static observations
- is the mean of the dynamic observations
- is the standard deviation of all observations
- is the number of static observations
- is the number of dynamic observations
- is the total number of observations
When we use Python to calculate this correlation, we end up with a coefficient of and a p-value of . These results can be interpreted as follows: a value of indicates a moderate negative relationship between the variables. Considering the way the binary variables have been assigned, this means that static languages tend to have lower execution times than dynamic ones. However, a p-value of is significantly above the standard threshold; practically, this means that if there were no difference in the distributions of both groups, there would be a 9.03% chance that we would observe a correlation this extreme or more.
Rank-Biserial correlation
Since there are significant outliers, this first method was rather naive. The Point-Biserial correlation also assumes that the continuous variable is normally distributed, which is not the case here; this might also explain the high p-value. Instead, we can use the Rank-Biserial correlation, as it is much less sensitive to outliers because it is based on the ranking of data instead of raw values. It is also more robust with such a small sample size, and it does not assume a normal distribution. The Rank-Biserial correlation is derived from the Mann–Whitney U test, a nonparametric test for comparing two independent samples: it ranks all observations, computes the sum of the ranks for both groups, and calculates the U statistics based on those ranks. (Wikipedia contributors, 2025a)
These are the required formulas:
- is the number of static observations
- is the number of dynamic observations
- is the sum of the ranks in the static group
- is the sum of the ranks in the dynamic group (not needed for this version of the formula)
Based on these two statistics, we can derive the Rank-Biserial correlation:
Once again we use Python to calculate this. We end up with a coefficient of , which is reassuringly similar to the calculated Point-Biserial correlation. Just like the first method, it indicates a moderate negative relationship, meaning static languages tend to have lower execution times than dynamic ones. The Mann–Whitney U test also gave a p-value of about , which tells us that the difference between the average execution time of each group is statistically significant (the chance that the rank differences observed are this extreme or more, given no difference between the distributions of both groups, is 0.055%).
Per-program analysis
We can also compute this same correlation per program, which can reveal whether dynamic languages prevail in performance for any of the programs, and whether any individual programs are skewing the results massively in favor of static languages. Below is a table of results for the Rank-Biserial correlation per program, along with their respective effect sizes and p-values, computed using Python:
| Program | p-value | Rank-Biserial | Effect size |
|---|---|---|---|
| 100 doors | 0.0728 | −0.5918 | medium–large |
| factorial | 0.1649 | −0.4694 | medium |
| fibonacci sequence | 0.0023 | −0.9184 | very large |
| fizzbuzz | 0.4557 | −0.2653 | small |
| reverse a string | 0.0973 | −0.5510 | medium |
| selection sort | 0.3829 | −0.3061 | small–medium |
| sieve of eratosthenes | 0.0262 | −0.7143 | large |
Table 2: Per-program Mann–Whitney p-values and signed Rank-Biserial effect sizes.
The table above coincides very well with our previously observed correlation: not a single program displays a deviation in direction from our overall correlation; all of the coefficients are negative, meaning the results all suggest that static type systems tend to have better performance. There is a wide variation in effect size, however, meaning that the results of some programs are closer across languages. Some of the p-values also suggest that the correlation is not at all statistically significant — like that of the selection-sort program. The fibonacci-sequence program in particular shows a very large and statistically significant correlation, with a p-value of about one-fourth of a percentage point. Overall, the programs that contribute most to the overall correlation are the sieve of eratosthenes and the fibonacci-sequence programs.
Per-language analysis
To further exemplify the degree to which the pattern of statics being faster than dynamics persists across languages, we can compute the mean of each language. This way, we can see whether all static languages are faster than all dynamic languages, or whether there are outliers:
| Language | Avg time (ms) |
|---|---|
| C | 104.00 |
| Rust | 476.43 |
| Go | 675.00 |
| Swift | 860.86 |
| Lua | 886.29 |
| PHP | 894.14 |
| C# | 968.86 |
| Python | 1243.71 |
| Java | 1513.57 |
| Kotlin | 1521.86 |
| JavaScript | 1998.71 |
| Perl | 2849.71 |
| Awk | 8498.71 |
| Julia | 13277.14 |
Table 3: Average execution time by language, sorted from fastest to slowest.
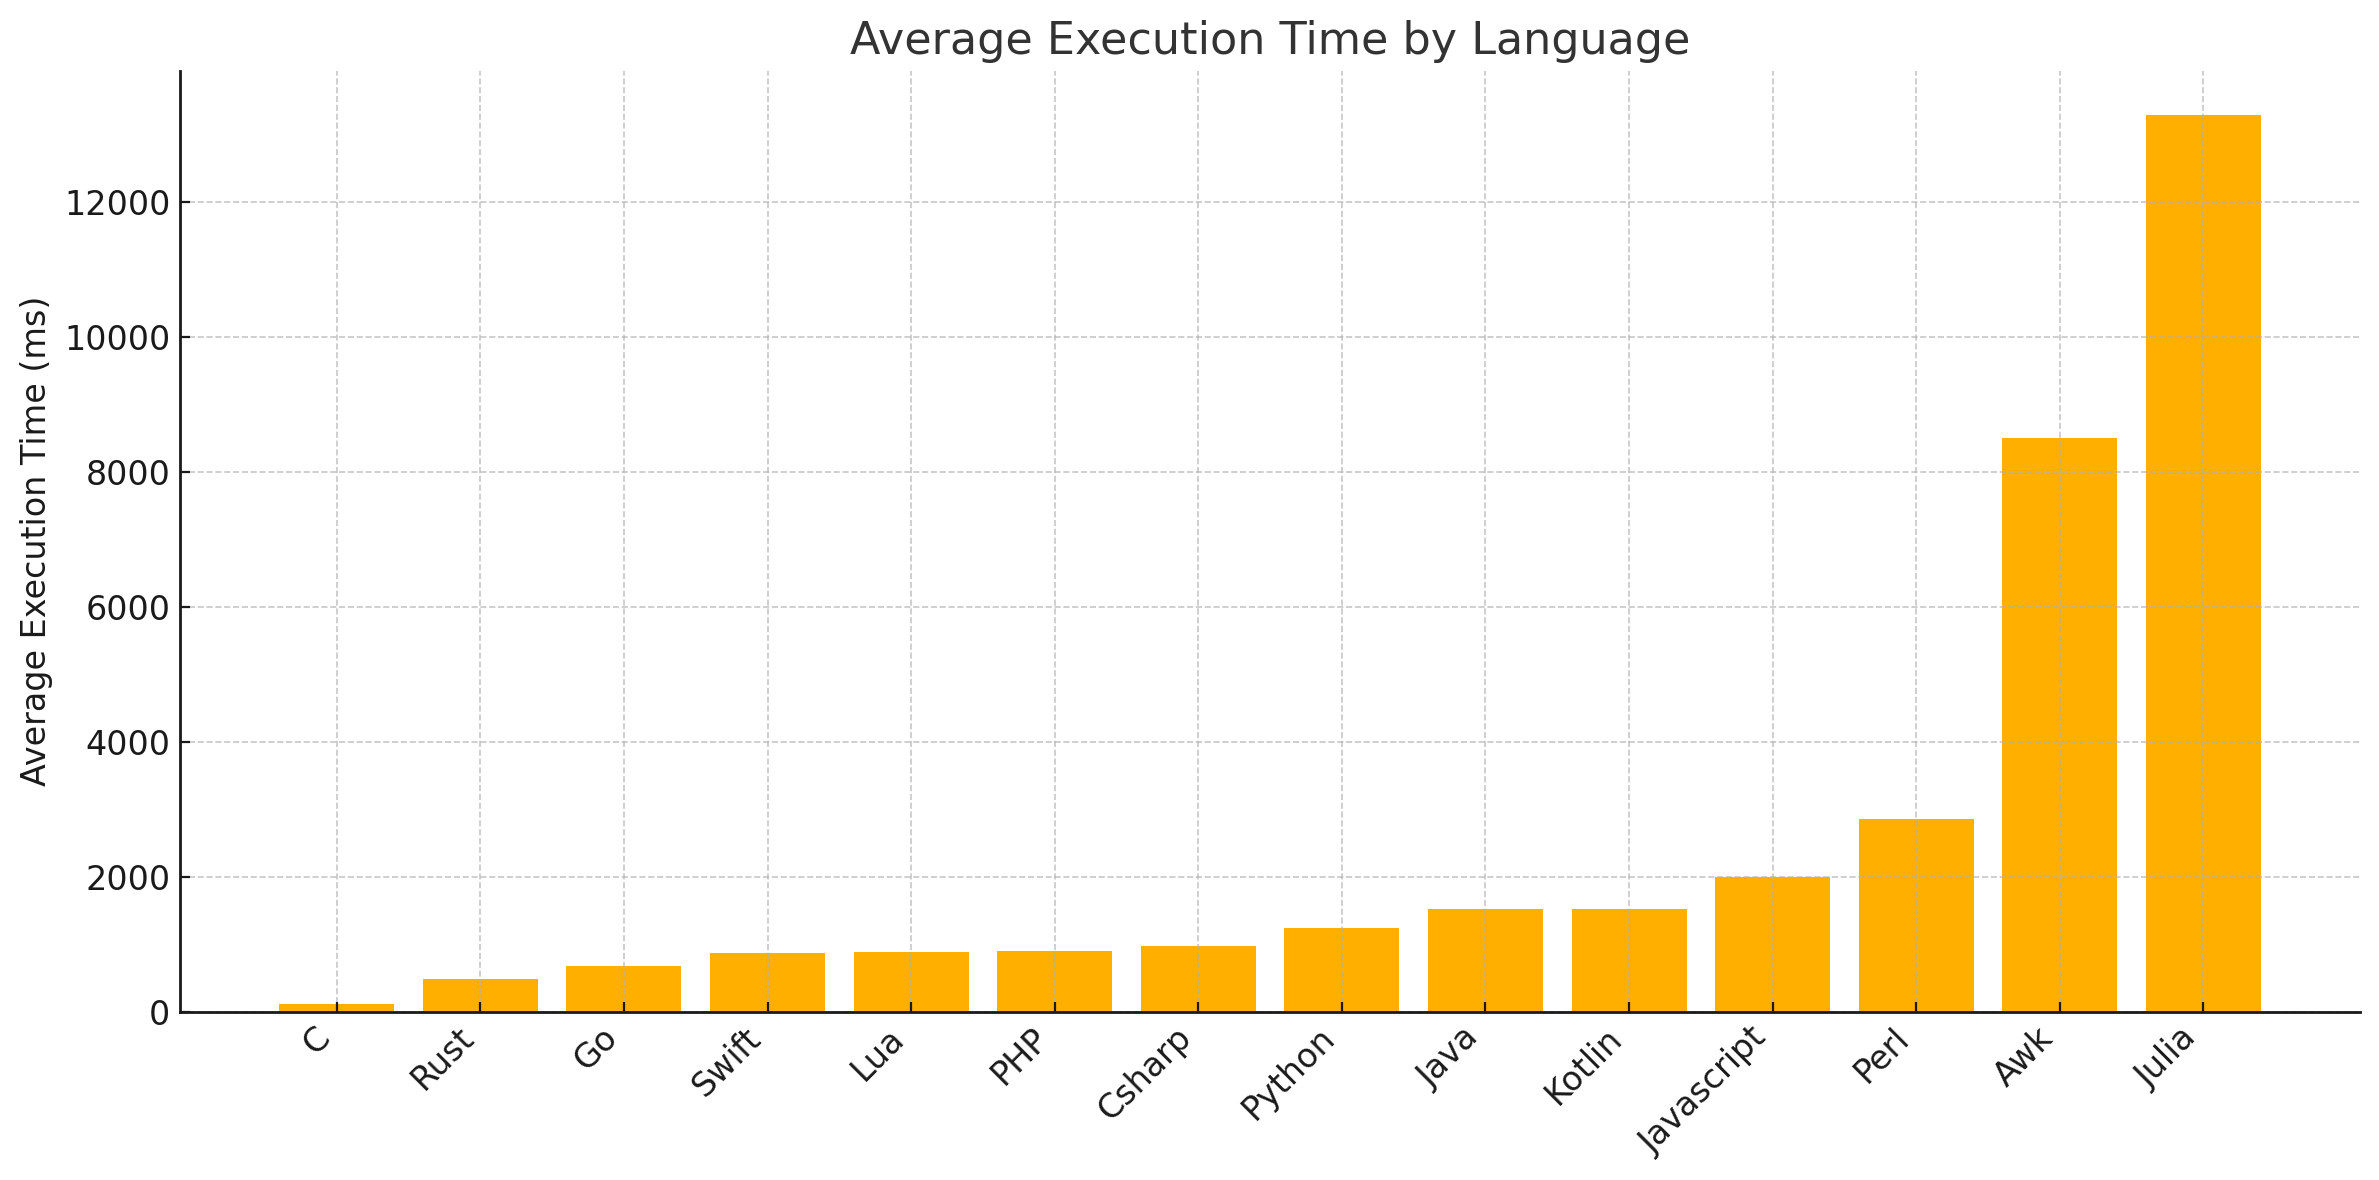
Not every static language is faster than every dynamic language, although there is still a general trend in that direction, even when ignoring Awk and Julia. Both Lua and PHP are among the fastest languages, while Java and Kotlin are some of the slowest. So out of the 14 languages, 4 are outliers in the general trend of static being faster than dynamic. We can also see a rather massive level of performance spread: the fastest language (C at 104 ms) is about 128 times faster than the slowest (Julia at 13277 ms). Overall, this chart supports the observed trend even further, even when ignoring the two main outliers.
Conclusion
Interpretation of results
Based on the obtained results, we can conclude that there is a moderate negative correlation between type system and performance, meaning that static languages tend to perform better.
Something else we can learn from the results is the effect of the genre of program on performance. As we can see in the table of correlations per program, the sieve and fibonacci-sequence tasks display a much more significant correlation between type system and performance, while tasks like fizzbuzz and selection sort display a very weak and statistically insignificant correlation. This suggests that heavier tasks, such as recursive ones (the fibonacci sequence), tend to perform better in static type systems than tasks using simple loop structures and I/O operations.
Evaluation of criticisms
The conclusions drawn above can be called into question based on a few criticisms; the first being the small sample size. Even though we had 98 individual data points, to prevent artificial inflation of the sample size (which could skew the correlation calculations) we used the mean of the 14 languages. As we can see in the boxplots, there were major outliers present. Both of these outliers were dynamic, but it is entirely possible that this observation is coincidental, and that if different languages had been chosen we would have obtained a very different distribution of outliers. Although this criticism is valid to some extent, it does not mean that the obtained correlation is invalid: the method used to compute the overall correlation — the Rank-Biserial correlation — was based on rank, not raw value, which partially mitigates the effect of those outliers. However, the relatively small sample size of languages (14) allows these outliers to remain significant. What also dampens this criticism somewhat is the fact that, when looking at the mean times for each language, we can still clearly see the same pattern even when ignoring those two dynamic outliers (although not every static language is faster than every dynamic one).
Another valid criticism is that the idea that "heavier" programs (such as recursion-heavy ones) exemplify this correlation further is based on the results of only 7 programs. This observed pattern can therefore not be declared definitive.
Some other, more general criticisms are that, as stated earlier, the programs and languages were not selected randomly, and that the sample size simply isn't high enough, making it difficult to state any conclusions definitively.
Additional considerations
To be clear, an observed correlation between static typing and better performance does not entail that static typing causes better performance. There are many other factors which might generally coincide with static typing that cause better overall performance.
This research also ignores certain factors about each language, such as the compilation stage for the compiled languages and the startup time for the compilers and interpreters; since we only measured execution time, compilation was cut off completely from the measurements. If a language has horrible compilation speeds but great execution speeds, it would perform well in this type of research compared to a language with fast compilation but slow execution — i.e., even if the first language took 10 times longer after pressing the start button, it might still get a better result (though, practically, this would only matter when, for example, creating code in an editor; most of the time, programs will already have been compiled). But overall, execution time is still the most logical metric for performance.
Another consideration is the simplicity of these example programs compared to real-world production code. Real-world, large-scale code could give us a radically different result; e.g., real-world programs often integrate a vast array of libraries, or use concurrency, which none of the implementations here do. This correlation alone is also not a fully-fledged reason to pick static type systems over dynamic ones for practical use cases — there are many other considerations to make, like ease of use, complexity, and versatility.
The consensus among computer scientists seems to be that dynamic type systems are generally more useful for prototyping, while programs written in static languages take more time and effort but are better for large-scale, long-term projects. This paper supports that claim, at least in terms of the idea that statically typed languages display better performance and therefore have an advantage for large-scale projects.
Overall, the conclusions we can draw are that the results suggest a moderate correlation between type system and performance, that static languages tend to perform better, and that heavier tasks (e.g., recursive programs) exemplify this correlation even further. But this conclusion is not a final verdict; more expansive and fleshed-out research could provide a more definitive result.
Incentive for future research
Considering the limitations of this paper, there is great incentive for a successive research project following a similar structure. A follow-up like this should have far more resources at its disposal to achieve significantly independent and worthwhile results. With these resources, the selection of languages could be not only much larger but also random, which should achieve a much more statistically significant result. Bias caused by interfering processes could be minimized by running the programs on a "clean-slate" machine, and the number of iterations and programs could be scaled up with a more powerful processor (along with the program complexity). Using more programs could also give a clearer view of the observed correlation between the "heaviness" (such as recursivity) of a program and the tendency of static languages to perform (even) better.
References
- GeeksForGeeks. (2019). Type systems: dynamic typing, static typing & duck typing. geeksforgeeks.org
- Pierce, B. C. (2002). Types and programming languages. Cambridge, MA: MIT Press.
- Wikipedia contributors. (2025a). Mann–Whitney U test. en.wikipedia.org
- Wikipedia contributors. (2025b). Pearson correlation coefficient. en.wikipedia.org
Appendix
The original paper includes a full appendix with the Bash benchmark script and the C# source code for every program. Those are omitted here for readability; the complete appendix is in the original PDF.